Accessing company financials using the SEC EDGAR API
Knowing your customer and their financial performance is key to responsibly assessing trade finance risk. Here we'll dig into one of the largest publicly available data sources on company financial performance: the U.S. Securities and Exchange Commission (SEC) EDGAR database. I’ll demonstrate a free and easy way to access public company financials using the SEC EDGAR API and Python.
What is the SEC EDGAR database?
The SEC is charged with protecting financial investors and maintaining efficient capital markets in the US. As part of their mission, the SEC maintains financial records of all US publicly listed companies in their EDGAR database. This includes the frequently sought after 10Ks and 10Qs that make up the financial statements many investors use to evaluate company performance.
EDGAR API
First a caveat, the SEC EDGAR API is not the only way to access EDGAR data. You can bulk download zipped files here. But if you want to develop an automated pipeline (or if you’re like me and hate clicking on things and love Python) the API route is the way to go. The SEC provides some basic API documentation but there are some gaps that need to be filled in.
There are three main data API endpoints that offer different ways of slicing the EDGAR data:
- data.sec.gov/api/xbrl/companyconcept/
- data.sec.gov/api/xbrl/companyfacts/
- data.sec.gov/api/xbrl/frames/
The companyconcept endpoint returns all the filing data from a specific company for a specific accounting item. So, if you’re just interested in getting a timeseries of, say, reported ‘Assets’ from Apple Inc., this is the one you’d want. The companyfacts endpoint returns all the data from filings for a specific company. I like to use this one if I’m interested in more than one accounting item, or want to browse the available accounting tags for that company. It also requires fewer API calls which can speed things up under the SEC request rate limit. Lastly, the frames endpoint will return a cross-section of data from every company that filed a specific accounting item in a specific period. This is great for doing quick company comparisons.
From a quick glance at the documentation you’ll see CIKs and accounting tags mentioned but not much on what these are and where they come from. I’ll try to fill in some missing detailings here:
CIK stands for Central Index Key and is a 10-digit identifier for companies making a filing. You can manually search for these through the EDGAR website (note you’ll need to prepend enough 0’s to make it 10 digits), but I’ll show a shortcut below that will get you the full list of well-formed CIKS in a few lines of code.
Accounting tags are strings that label items in the financial statements and tend to come from either US-GAAP or IFRS accounting taxonomies. There are no two ways about it, sifting through accounting taxonomies to figure out if you need 'AccountsPayable', or 'AccountsPayableCurrent' can be a headache, particularly if you don’t have a background in accounting. An interactive taxonomy guide can be found here which helps with understanding the tags.
Lastly, you’ll need to define a header in your API request. Although the service is free, and an API key is not needed, they require you to declare a user agent which is as simple as an active email address. Knowing this will save you a bunch of time trying to figure out why you’re not getting a successful response code (200) even though your URL appears to be correct.
The code!

Now for the fun stuff. Let’s start by importing the libraries we’ll need. If you don’t have these already installed you can simply pip install them.
Next we’ll load and process the ticker-company name-CIK mapping file, which keeps us from having to manually search for company CIKs. This code is borrowed from a great Medium post by Antoine Dedave, otherwise you’d need to dig into the developers FAQs to know this file exists.
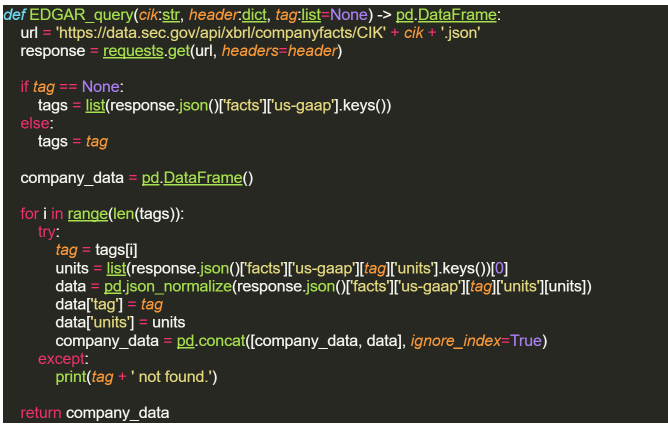
To retrieve the EDGAR data we’ll define the following function that can both pull down the entire EDGAR database (given enough time), or specific data from a list of tags. We’ll build it around the companyfacts endpoint to give us flexibility in the tags we want returned and reduce the number of API calls. The function will take three arguments: a company CIK, a header dictionary, and a list of tags. If no tags are given, we’ll define the default to return all tags for the given company (the full EDGAR download).

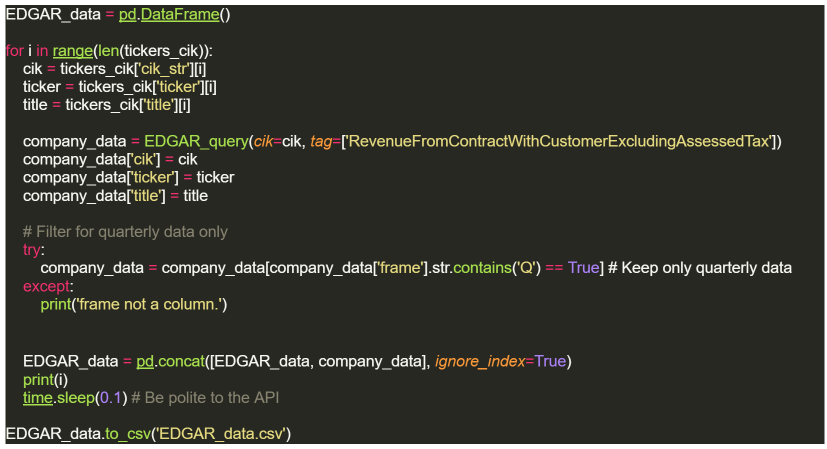
To build the data frame, we’ll execute this function by looping over each company in the tickers_CIK dataframe we built above. We added exception handling in the function above so the iterations complete even if a company doesn’t have data for the tag we’re interested in. By iterating through the companies we’ll also be able to ensure we don’t get booted from the API by respecting the rate limit of 1 request every 0.1 seconds. To preserve all our computer’s hard work, we’ll save the dataframe to a csv at the end.

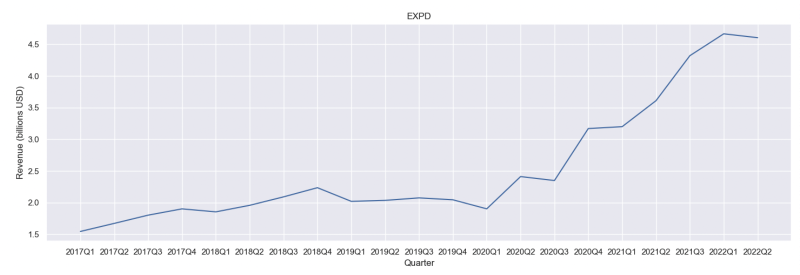
Let’s quickly visualize some of the data we just downloaded. As an example we’ll look at quarterly revenues for one of the largest US-based global logistics companies, Expeditors International of Washington Inc. We’ll also clean up the data a bit to make a more readable figure.

This is some impressive revenue growth since 2020!
Take home
With this framework, it’s easy to access the free SEC EDGAR API and develop an automated data pipeline. Whether you’re interested in assessing financial performance, or building risk models that leverage financial statements, this tutorial should help you get off the ground. But this is just the tip of the iceberg for how data science can help automate trade finance. Be sure to check out the innovative, data-driven trade financing products we’re building at Fishtail.